Mapping and Geographic Information Systems
CHASR provides a range of geographic information system (GIS) and geospatial data visualization services, including:
- Geospatial data-related services:
- Conversion of textual or descriptive information into locations via geocoding methods (i.e., postal address/postal code, linear referencing), including assigning different administrative or census boundaries information to locational data.
- Onscreen digitization and feature extraction, which includes extracting information from scanned maps or digital imageries from different sources including aerial photos, satellite images, drone images, etc.
- Census geography and census data, including extracting and preparing census-based socio-demographic variables at different scales such as census boundaries, administrative, and other regions (i.e., constituencies, neighborhood boundaries in urban areas, user-defined regions, etc.). CHASR can also link postal code and forward sortation areas (FSA) with other spatial or nonspatial data.
- Digital image processing and georeferencing historical air photos.
- Technical services in preparing high-resolution maps for different documents including manuscripts, reports, knowledge translation material, community consultation material, community and household level surveys/fieldwork, and research posters.
- Support for selecting appropriate mapping design elements for your data (i.e., scale, projection, layout, symbolization, typography, type).
- Representation of geospatial data using a variety of thematic maps: Choropleth Maps, Dasymetric Maps, Isoline Maps, Dot Maps, Cartogram Maps, Flow Maps.
- Static high-resolution maps for manuscripts, presentations, and reports.
- Dynamic or animated time-series maps that may be embedded into presentations or on websites.
- Cartographic representation of different types of data (i.e., spatiotemporal, bivariate, and multivariate data, flow data).
- Statistical mapping, including enumeration, normalization, and classification.
- Interactive web mapping and geo/data visualization (using ArcGIS Online platform, Tableau, MS Power BI, ArcGIS API for JavaScript). Development and maintenance of WebGIS platforms through custom development and software solutions (JavaScript and libraries for interactive maps such as Leaflet, OpenLayers, etc.).
Other Data Visualization Services
Complementary to our data analysis and reporting services, we offer data exploration through different types of visualizations to help uncover patterns and qualitatively assess relations:
- We provide a range of visualization options, from static data visualizations, such as graphs, charts, scatterplots, diagrams, word clouds, sociograms, and multidimensional scaling to interactive web-based dashboards
- Depending on your needs, data visualization services may be performed using a wide array of software packages, including SPSS, STATA, R, Python, Tableau, NVivo, ArcGIS, NetDraw, Anthropac, and others
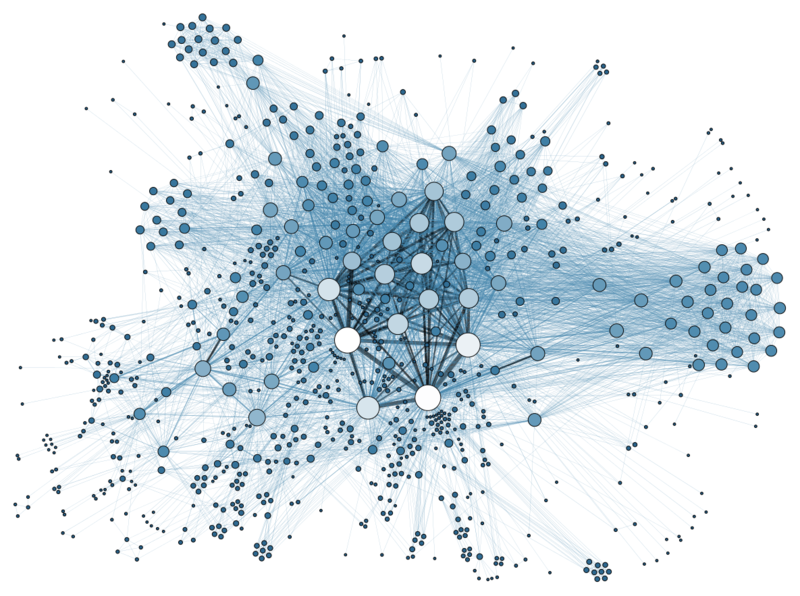
- We offer a variety of options for visualizing bibliometric, relational, flow, or social network data in a static, interactive, or animated/dynamic way, with the use of various packages like Gephi, Pajek, Python, R, NetDraw, and VOSviewer
- We also offer custom integrated data visualization solutions through web platforms and infographics